IELTS Writing Task 1: Sample Answers with Analysis (line graph, pie chart, process)
Updated
Below are three model answers for the most common Task 1 Academic types. All tasks and data were created for this article. Focus not on individual words, but on how the overview and detail paragraphs are organised. For general rules for Task 1, see the article “Writing Task 1 Academic”.
Example 1. Line graph
Task. The line graph shows the average number of hours per week that teenagers in one country spent on three leisure activities between 2000 and 2020.
Data: watching TV 18 → 15 → 9 hours; online games 3 → 8 → 12 hours; sport 6 → 6 → 5 hours (2000, 2010, 2020).
Answer (about 175 words):
The line graph illustrates how much time teenagers in one country devoted each week to watching television, playing online games and doing sport over a twenty-year period from 2000.
Overall, television viewing fell steadily while online gaming rose sharply, and by the end of the period gaming had become the most time-consuming activity. Time spent on sport, by contrast, hardly changed.
In 2000, television was by far the most popular pastime, with teenagers watching an average of 18 hours a week, three times as long as they spent on sport (6 hours) and six times as long as on online games (3 hours). Over the following decade, viewing dropped slightly to 15 hours, whereas gaming more than doubled to 8 hours.
Between 2010 and 2020 these trends accelerated. Television time fell to just 9 hours, and online gaming continued to climb, reaching 12 hours and overtaking television at some point in the second half of the decade. Sport remained the most stable activity throughout, dipping only marginally to 5 hours in 2020.
Analysis: the overview names three trends and the main outcome (games became the leader) without figures; details are grouped by period; precise comparisons (three times as long, more than doubled, overtaking); no reasons or opinions are given.
Example 2. Pie charts
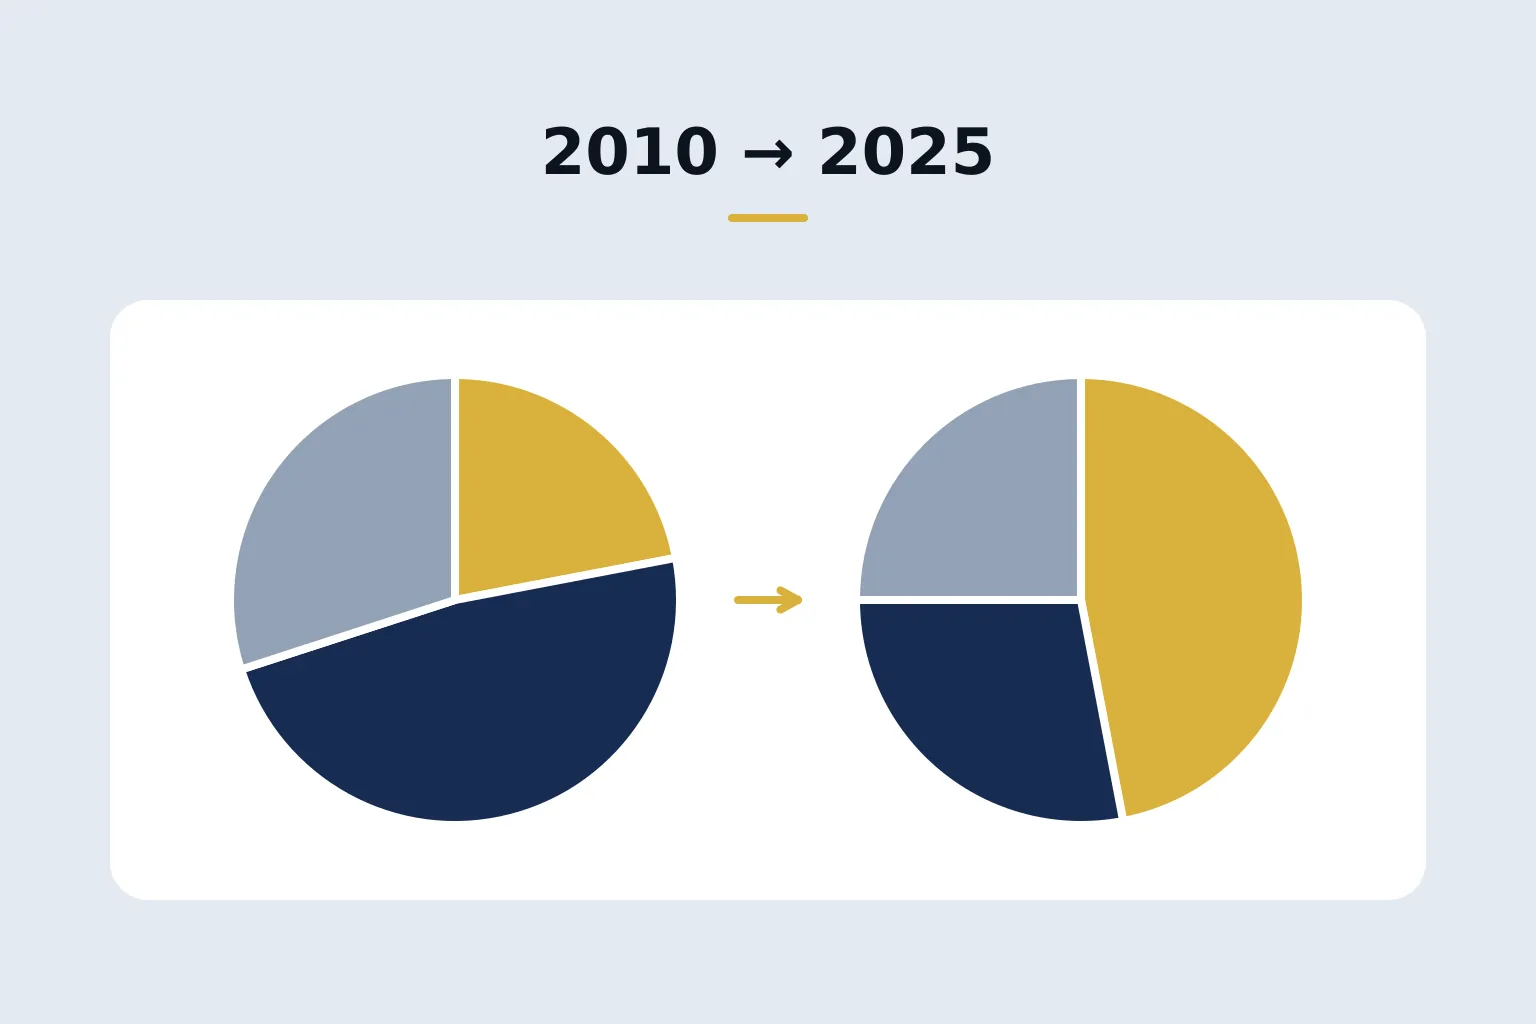
Task. The pie charts compare the sources of electricity in one country in 2010 and 2025.
Data: 2010 — coal 45%, gas 30%, nuclear 15%, renewables 10%; 2025 — coal 15%, gas 30%, nuclear 20%, renewables 35%.
Answer (about 170 words):
The two pie charts show the proportion of electricity generated from four different sources in a particular country in 2010 and 2025.
Overall, the country's energy mix shifted markedly away from coal and towards renewables, which became the largest single source by 2025. The share of gas, meanwhile, stayed exactly the same.
In 2010, coal was the dominant source, accounting for almost half of all electricity (45%). Gas supplied just under a third (30%), while nuclear power and renewable sources made up much smaller shares, at 15% and 10% respectively.
By 2025, the picture had changed considerably. The contribution of coal had fallen to only 15%, a third of its earlier level, whereas renewables had more than tripled their share to 35%, overtaking both coal and gas. Nuclear power also grew, though more modestly, rising by five percentage points to 20%. Gas continued to provide 30% of the country's electricity.
Analysis: for pie charts the language of shares is key (almost half, just under a third, a third of its earlier level); changes in shares are described in percentage points; the stable figure (gas) is mentioned in the overview — this is also a key feature.
Example 3. Process
Task. The diagram shows how recycled glass bottles are processed.
Stages: collection → sorting by colour → washing → crushing → melting → forming new bottles → delivery to shops.
Answer (about 165 words):
The diagram outlines the stages involved in recycling used glass bottles and turning them into new ones.
Overall, it is a linear process consisting of seven stages, beginning with the collection of used bottles and ending with the delivery of new bottles to shops.
First, used bottles are gathered from collection points and transported to a recycling plant. There, they are sorted according to their colour, typically into clear, green and brown glass, since different colours cannot be mixed. Once sorted, the bottles are washed thoroughly to remove labels and any remaining contents.
At the next stage, the clean glass is crushed into small fragments, which are then melted down in a furnace at a very high temperature. The molten glass is poured into moulds and shaped into new bottles. Finally, after cooling, the finished bottles are packed and delivered to shops, where they can be filled and sold again.
Analysis: the overview states the number of stages, the beginning and the end; the passive is used naturally (are gathered, is poured); varied sequencers (first, there, once sorted, at the next stage, finally) are used instead of repeating then.
How to use the samples
- Take a task and write your own answer in 20 minutes.
- Compare it with the model: do you have an overview without figures? Is the data grouped logically?
- Rewrite your own text — do not copy the model.
For another band 8–9 sample, more detail on processes and maps, and how to organise practice with feedback, see the Writing guide.
FAQ
Can I memorise sample answers for Task 1?
There is no point memorising them: the data will be different on test day. Use samples to understand the structure, the overview and the language of comparison.
How many paragraphs should Task 1 have?
Usually four: an introduction, an overview and two detail paragraphs.
Next step
Mock test
IELTS mock test
Listening, Reading, Writing and Speaking in the computer-based test format and IELTS band forecast on the 0–9 scale.
6 USDone-time
Go to mock testGuide
IELTS Writing at 8–9: How Top-Level Texts Are Written
Writing is the most difficult part of the exam for most test takers. Here we break down what actually earns an 8 and why 'clever words' do not help.
15 USD
Open guide