IELTS Writing Task 1 Academic: How to Describe Graphs, Tables and Processes
Updated
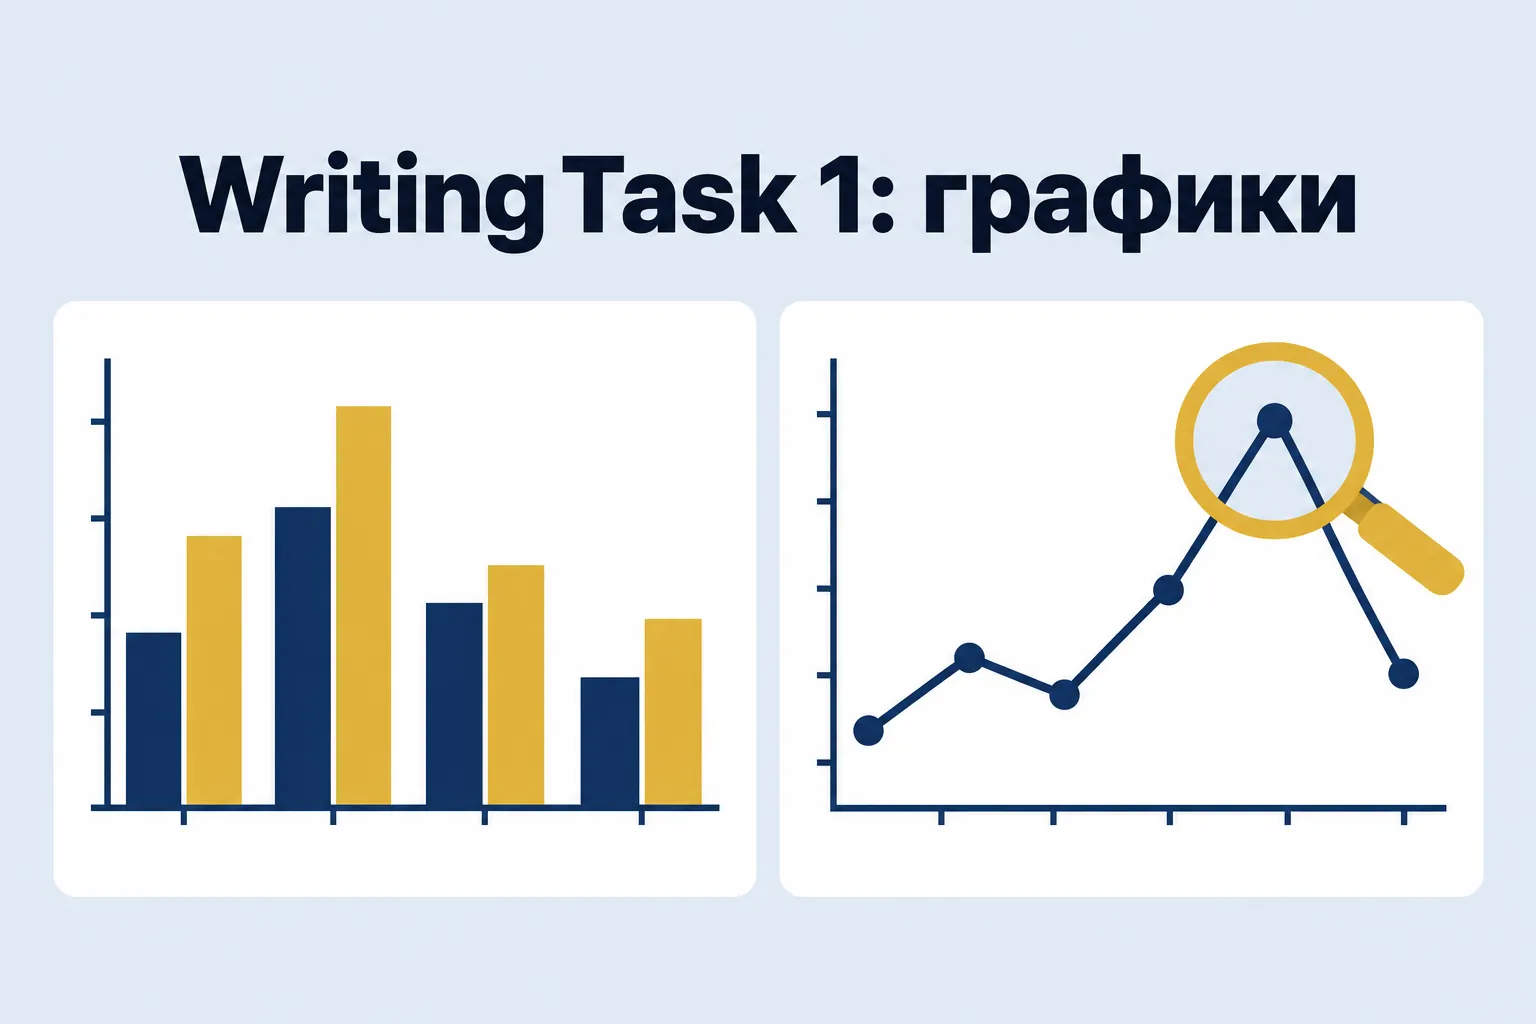
In Academic Writing Task 1 you need to describe visual information: a line or bar chart, pie chart, table, process or map. At least 150 words, about 20 minutes. Task 1 is worth half as much as Task 2, but a weak Task 1 can still cost you half a band in your Overall band score for Writing.
Structure
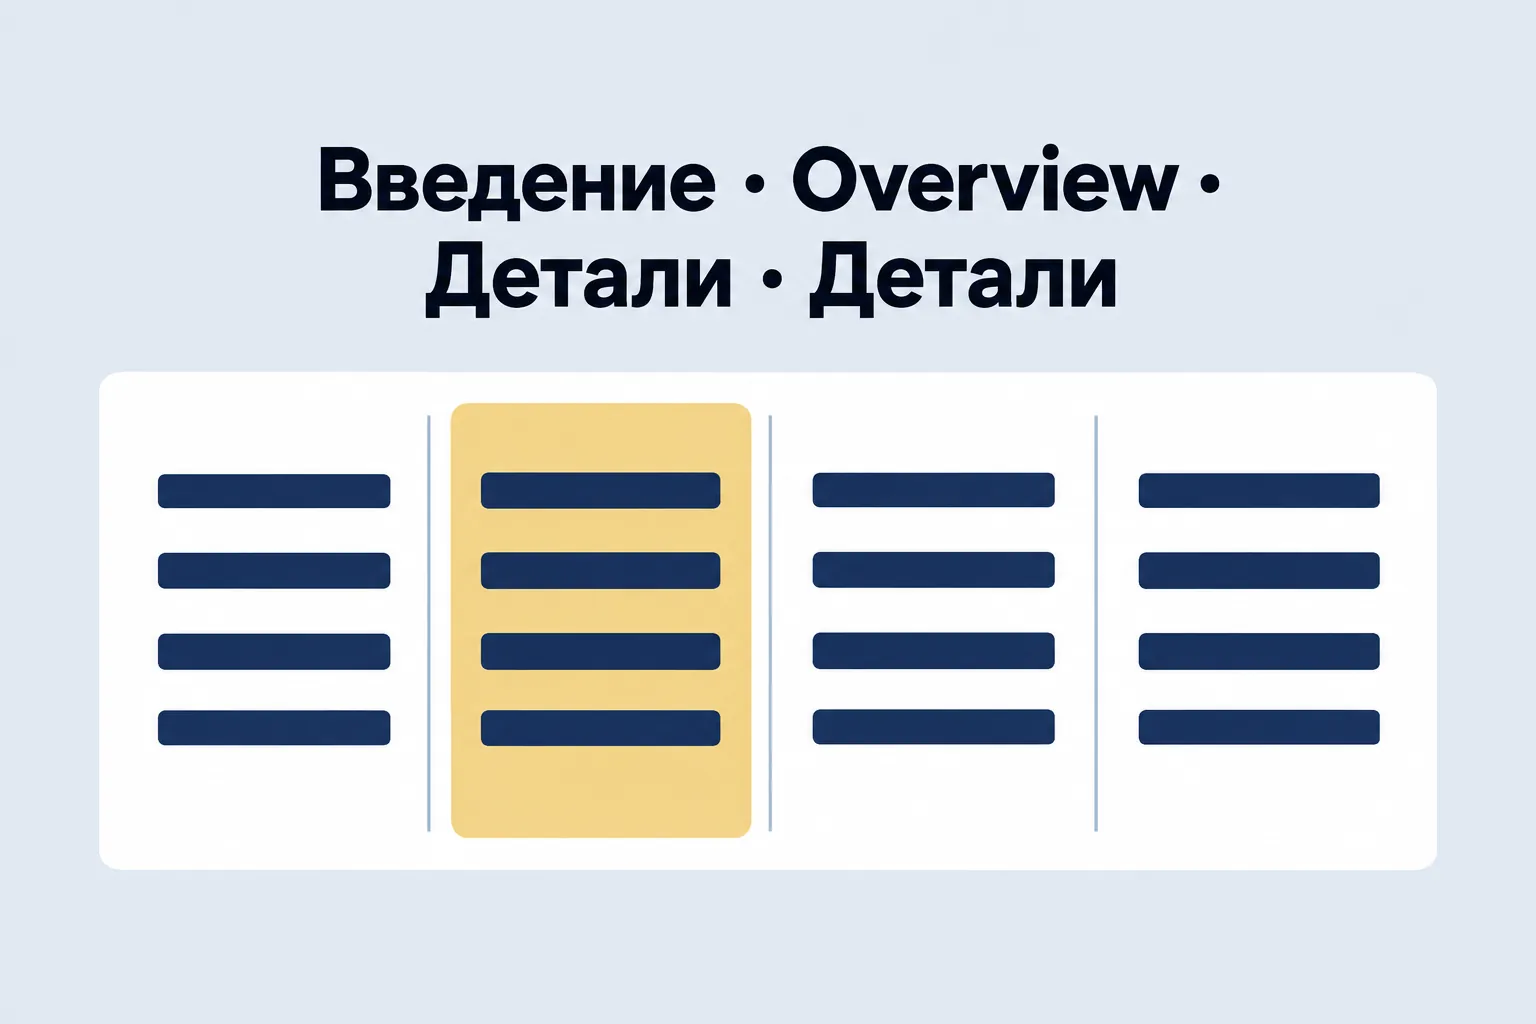
- Introduction (1 sentence). What is shown, where and over what period. In your own words, not a copy of the task.
- Overview (1–2 sentences). Main features without figures: the overall trend, the leader and the lowest category, the most noticeable change.
- Details, paragraph 1. First group of data with figures and comparisons.
- Details, paragraph 2. Second group of data.
Overview — The Most Important Part
Without an overview you cannot get a high band for Task Achievement. The overview answers the question: "What would a person see if they looked at the chart for three seconds?"
Example: Overall, the car remained the most common way of commuting in both years, although its share fell considerably, while cycling and rail travel became noticeably more popular.
Grouping Instead of Listing
A weak answer describes each column in order. A strong answer divides the data into two groups by a common feature: what increased and what decreased; large and small figures; the first and second period. Each group becomes a paragraph.
Language for Trends and Comparisons
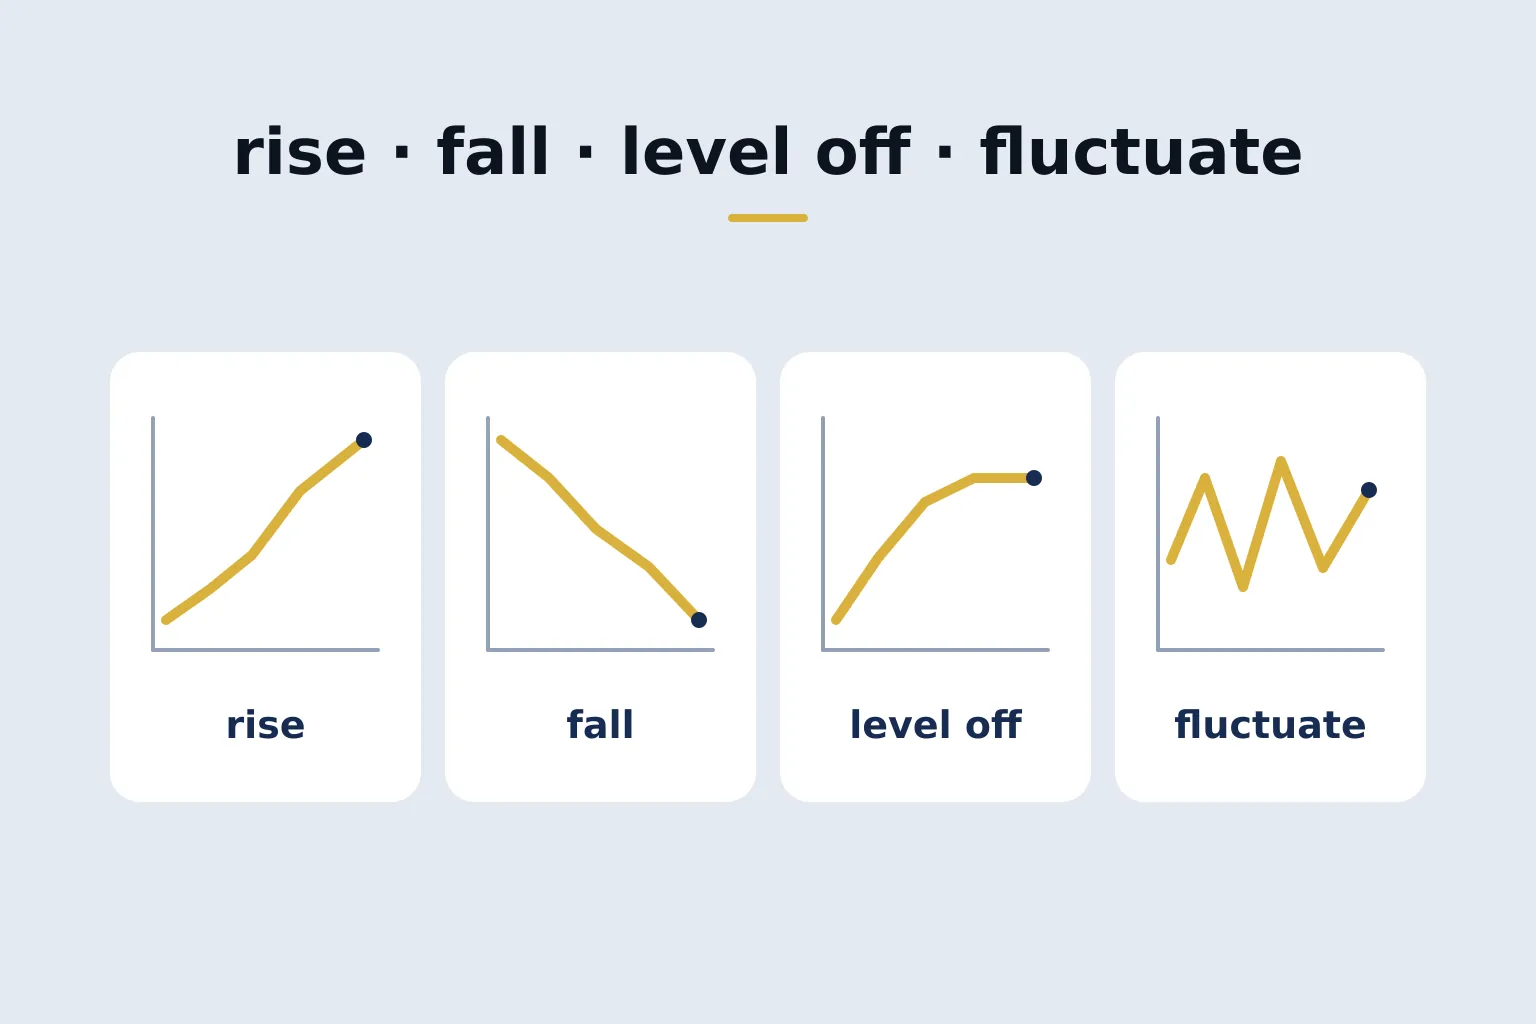
- Verbs: rise, climb, increase, surge, fall, decline, drop, dip, level off, remain stable, fluctuate, peak.
- Degree: slightly, marginally, moderately, considerably, substantially, dramatically. Use precisely: a rise from 20% to 21% is slightly.
- Comparisons: twice as high as, roughly a third of, the second largest, overtook, outnumbered.
- Approximation: just under a quarter, well over half, nearly, approximately.
- Percentages: the difference between 30% and 40% is 10 percentage points, not 10 percent.
Vary your structures: Car use fell sharply and There was a sharp fall in car use.
Tenses
The tense depends on the period shown. Past years — Past Simple. Changes up to a point in the past — Past Perfect (by 2020 the figure had doubled). Forecasts — is expected to, is projected to, will.
Processes
Overview: how many stages, where it starts and ends, whether it is a natural or manufacturing process. In the details — passive voice and sequencing linkers: First, the raw materials are collected. Once they have been sorted, they are...
Maps
Overview: main changes (new buildings, disappearance of green areas, new infrastructure). In the details — passive voice and language of place: The farmland to the east of the river was replaced by housing. A car park was built next to the station.
Common Mistakes
- no overview or overview with only figures;
- describing every figure without grouping;
- giving opinions or reasons for changes;
- copying the wording of the task in the introduction;
- incorrect tenses;
- percent instead of percentage points.
What Next
See a model answer at band 8–9 with analysis, more on processes and maps, and a practice plan — in the Writing guide. You can practise in exam conditions with a mock test.
FAQ
Do I need a conclusion in Task 1?
No separate conclusion is needed. Its role is fulfilled by the overview, which is best placed as the second paragraph.
How many words should I write in Task 1?
At least 150 words. The optimal range is 160–200 words.
Can I explain the reasons for changes in the graph?
No. In Task 1 you should only describe the data, without opinions or speculation about causes.
Next step
Mock test
IELTS mock test
Listening, Reading, Writing and Speaking in the computer-based test format and IELTS band forecast on the 0–9 scale.
6 USDone-time
Go to mock testGuide
IELTS Writing at 8–9: How Top-Level Texts Are Written
Writing is the most difficult part of the exam for most test takers. Here we break down what actually earns an 8 and why 'clever words' do not help.
15 USD
Open guide